|
MACKENZIE RIVER VALLEY TRANSECT, CANADA |
||||||||
|
CALM SITEs /C3 A, B/ C4 A, B/ C5 A, B/ C7 A, B/ C8 A, B/ C9/ C11
A, B/ C13/ C14 A,B/ C15 A,B Individual
CAPS II metadata forms for these sites can be accesses by clicking on Cite
codes below. Site
Photos can be accessed by clicking on corresponding site Photographs links |
||||||||
|
||||||||
|
||||||||
|
||||||||
|
||||||||
|
||||||||
|
||||||||
|
||||||||
|
||||||||
|
||||||||
|
||||||||
|
||||||||
|
Responsible for data submission |
Caroline
Duchesne Sharon Smith |
|
||||||
|
Email Address |
“caroline.duchesne”-at-“canada.ca” “sharon.smith”-at-“canada.ca” |
|
||||||
|
Institution/Organization |
Geological Survey of Canada Natural Resources Canada / Government of Canada Commission géologique du
Canada Ressources
naturelles Canada / Gouvernement
du Canada |
|
||||||
|
Location description |
Mackenzie
River valley, Canada |
|
||||||
|
Site Locations |
See Table below |
|
||||||
|
||||||||
|
Site
# |
Site
Name |
Lat |
Long |
Elevation
(m) |
|
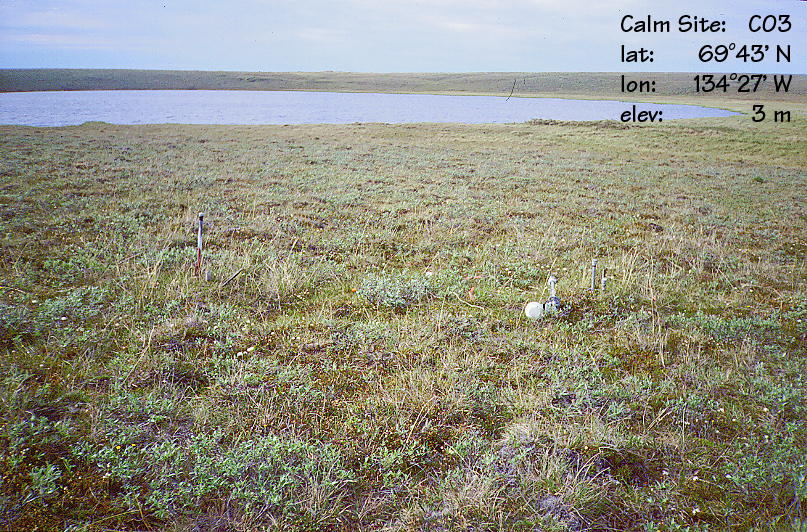
C3 |
North
Head |
69°43'11”
N, |
134°27'43”
W |
|
|
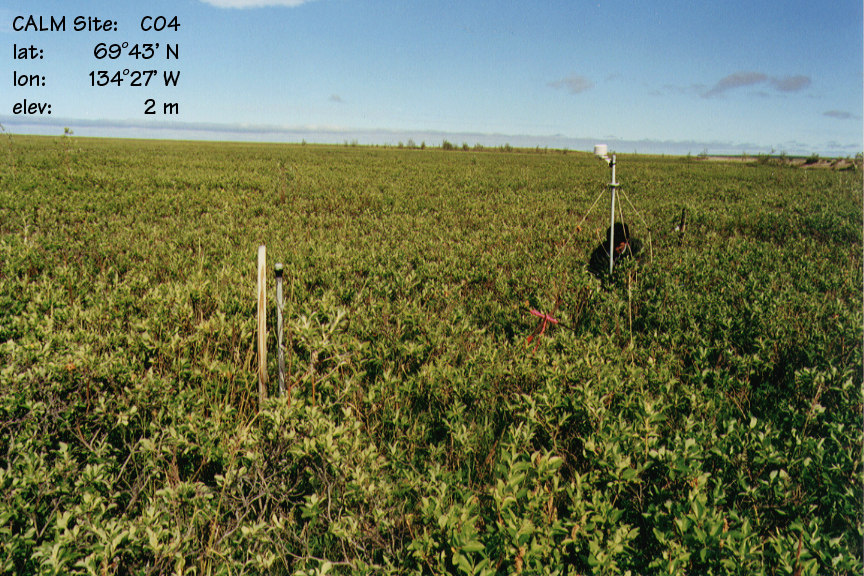
C4 |
Taglu |
69°22'
9” N, |
134°56'55”
W |
|
|
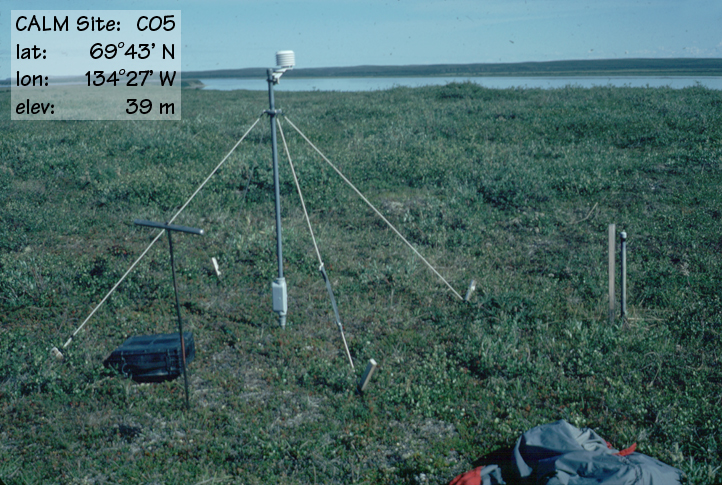
C5 |
Lousy
Point |
69°13'
8” N, |
134°17'28”
W |
|
|
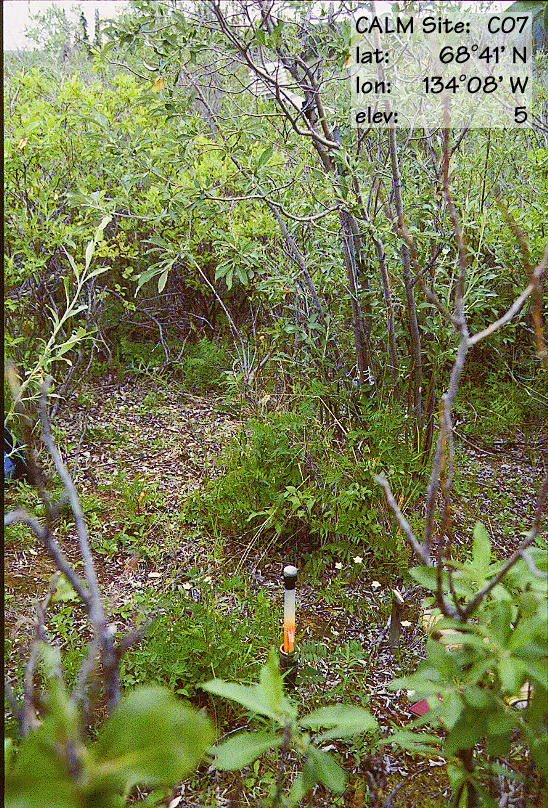
C7 |
Reindeer
Depot |
68°41'
5” N, |
134°
8'45” W |
|
|
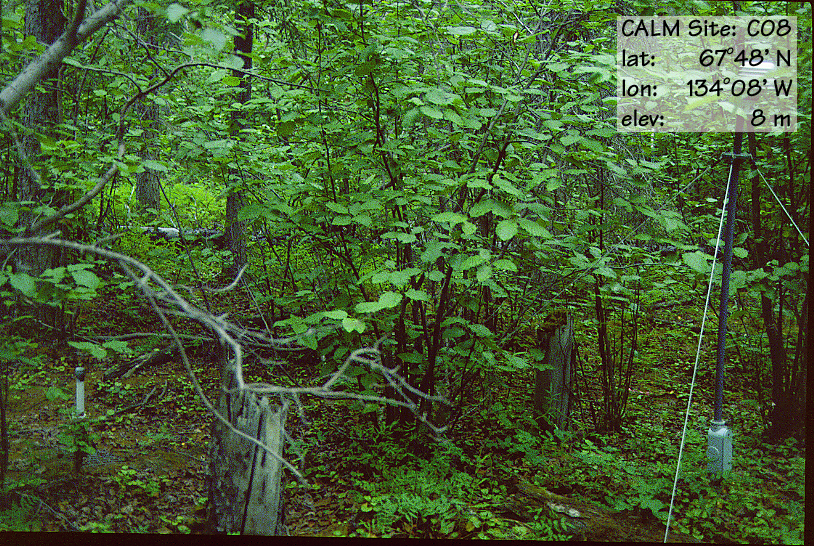
C8 |
Rengleng River |
67°47'42”
N, |
134°
7'34” W |
|
|
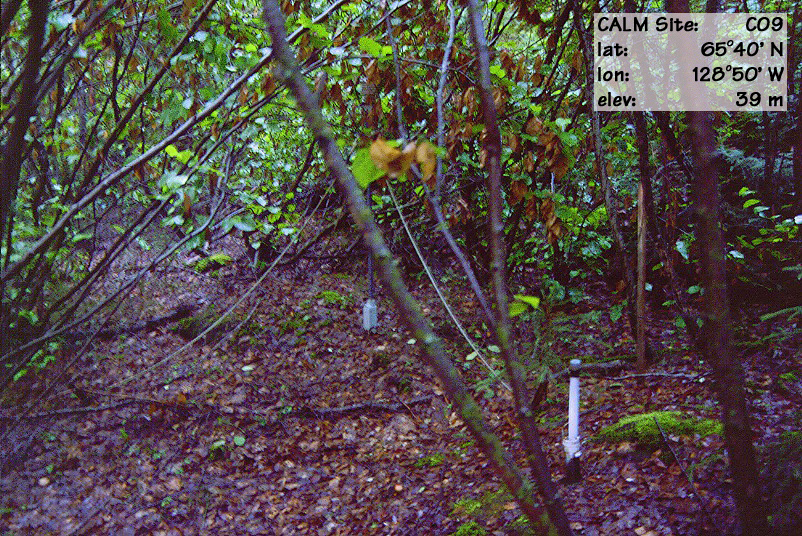
C9 |
Mountain
River |
65°40'25”
N, |
128°49'45”
W |
|
|
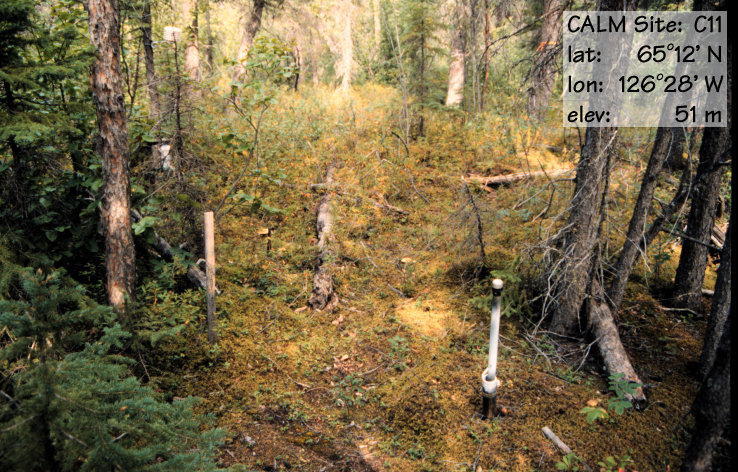
C11 |
Norman
Wells |
65°11'35"
N, |
126°28'
8" W |
|
|
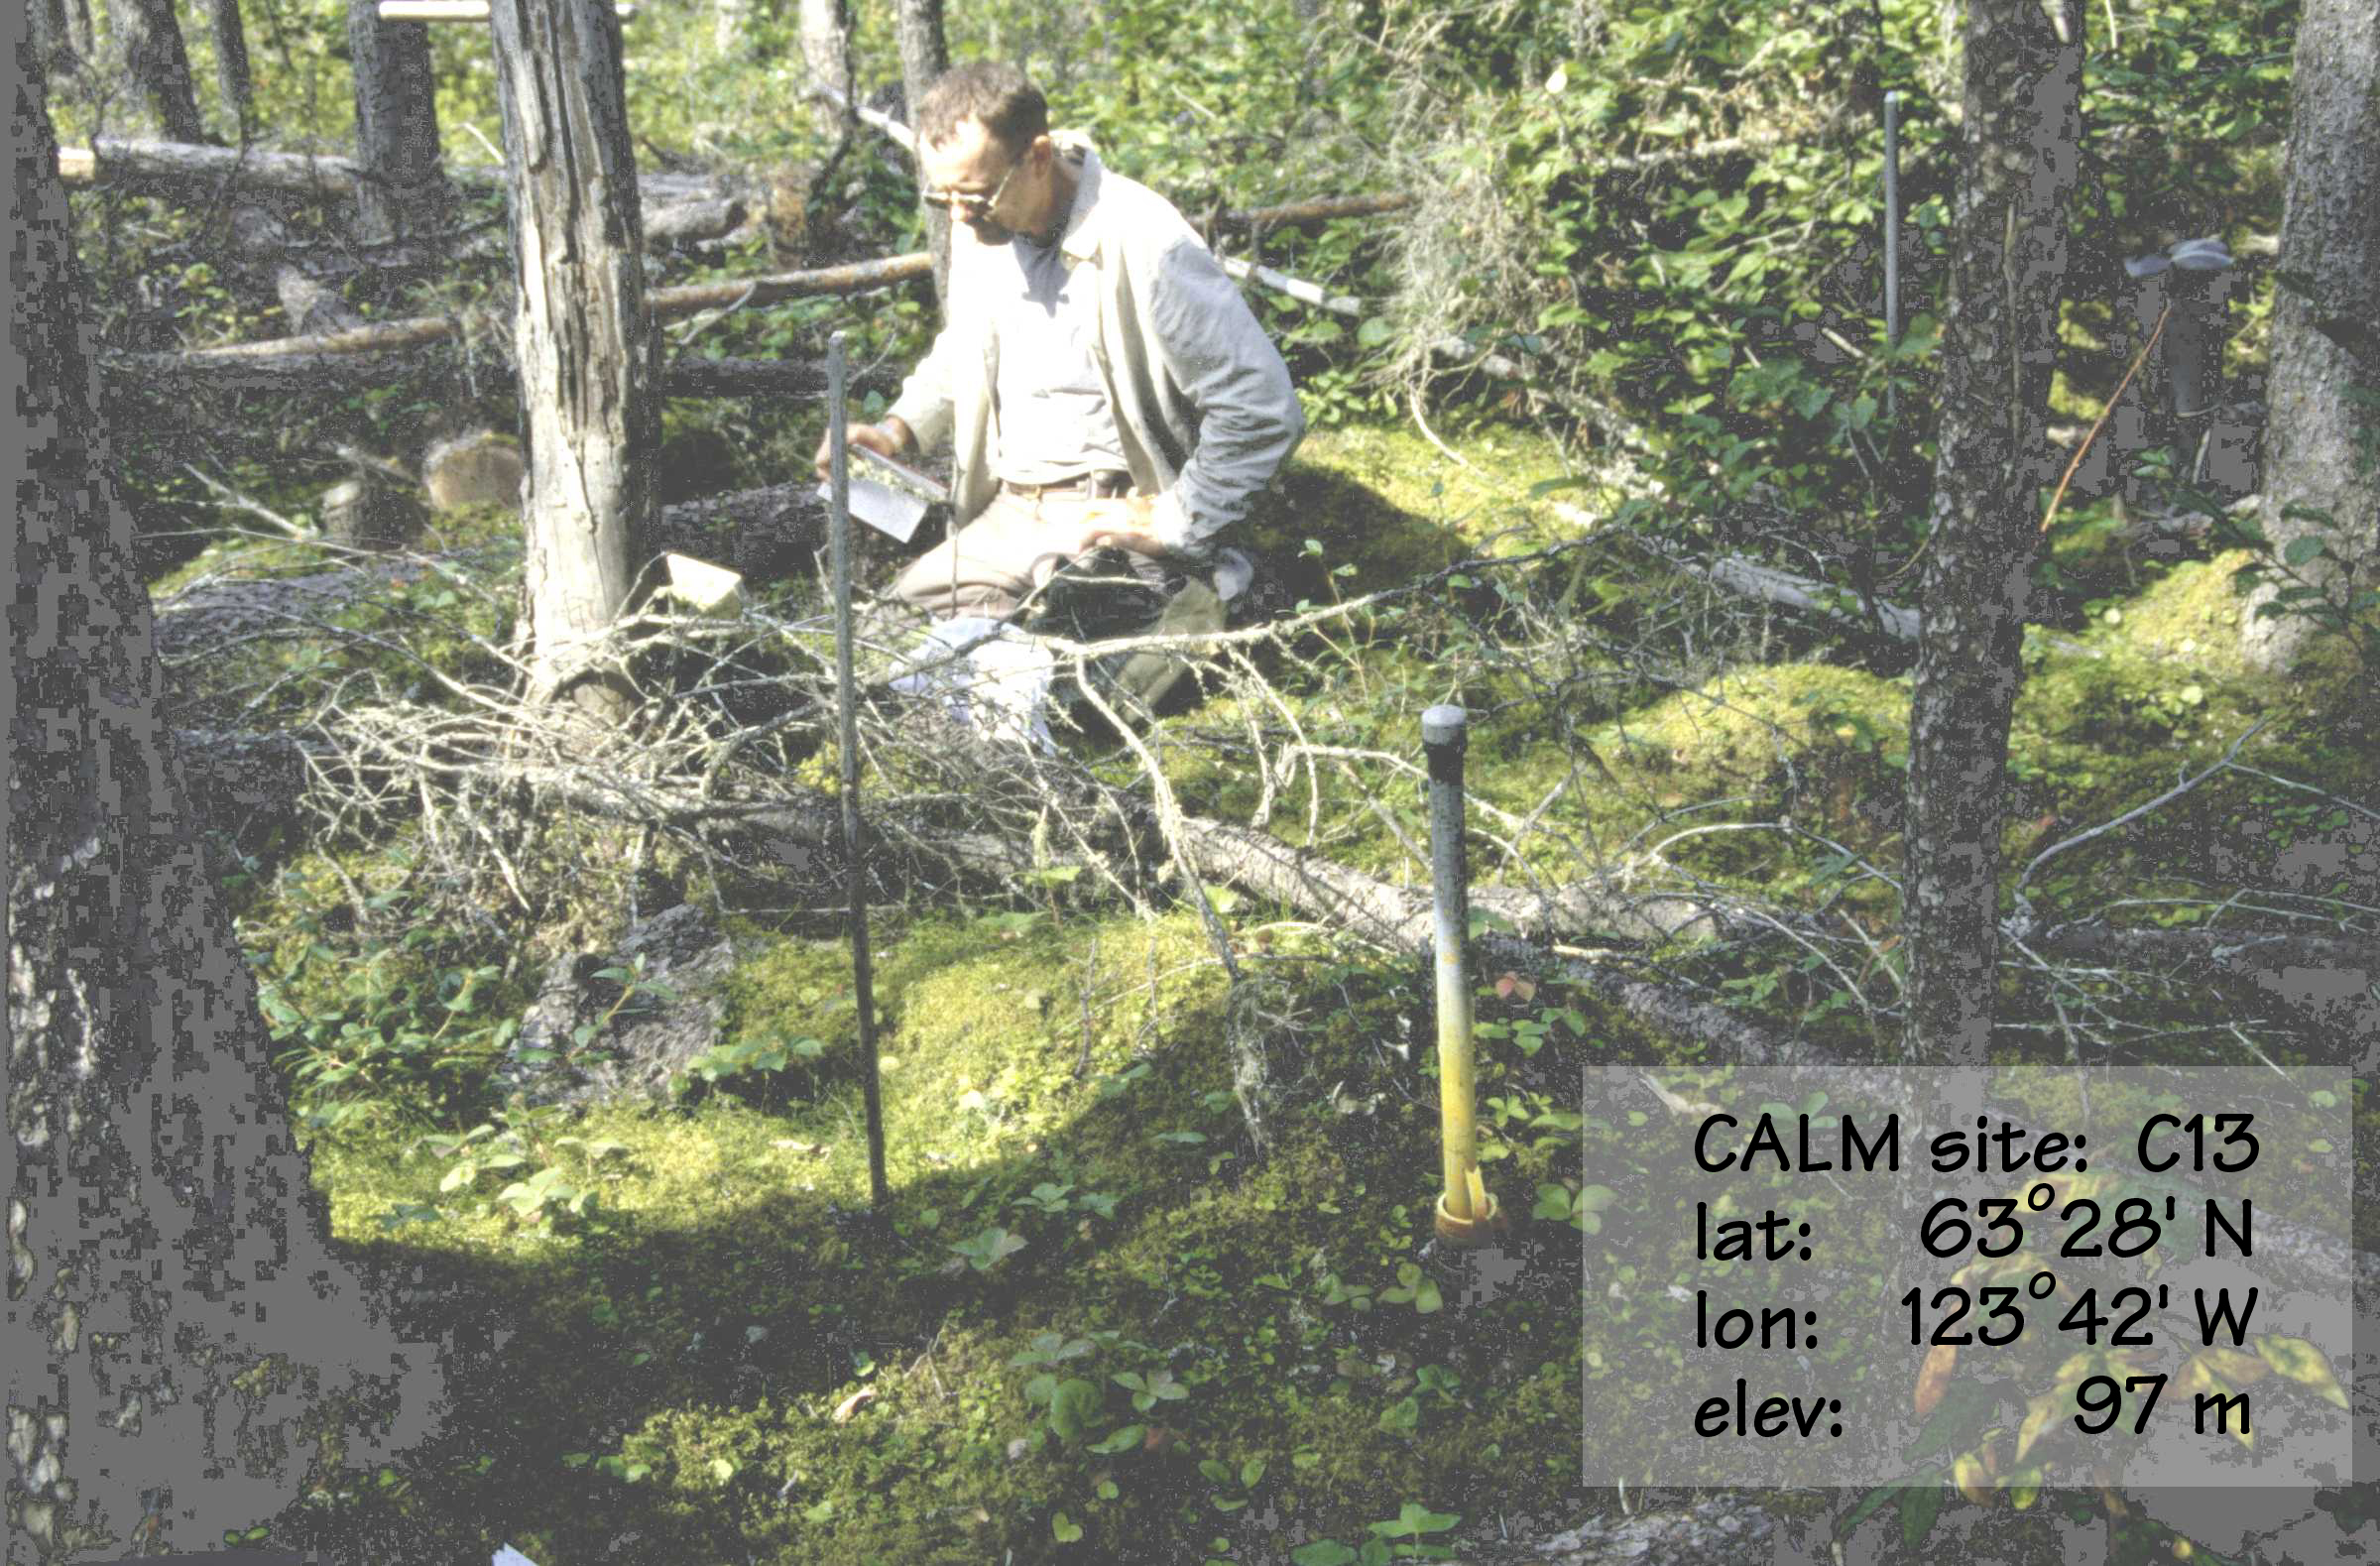
C13 |
Ochre
River (Thaw Tube) |
63°27'59”
N, |
123°41'34”
W |
|
|
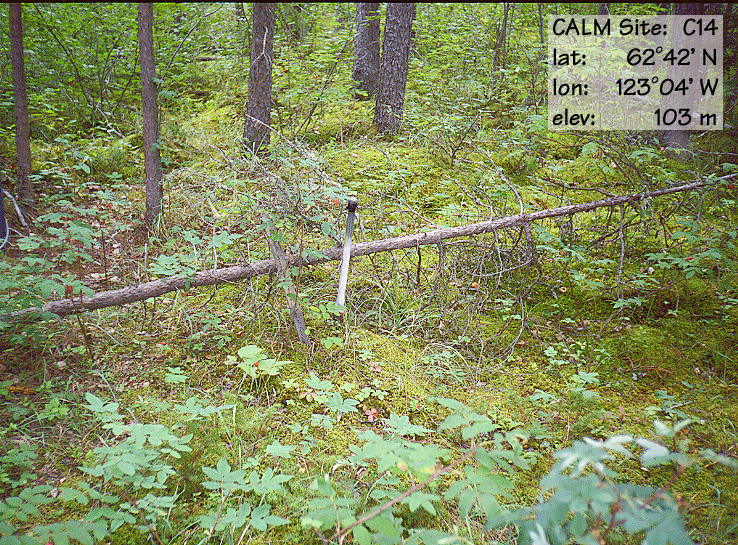
C14 |
Willowlake River |
62°41'48”
N, |
123°
3'54” W |
|
|
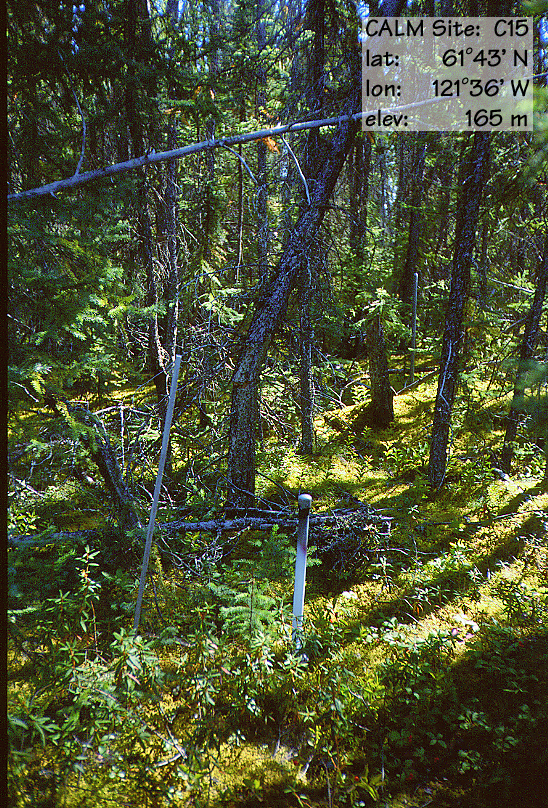
C15 |
Fort
Simpson |
61°53'16”
N, |
121°36'
6” W |
|
DESCRIPTION OF AREA CONTAINING SITES, SAMPLING
DESIGN AND METHOD:
The
active layer monitoring system extends from Fort Simpson, Canada in upper
Mackenzie River valley to the Beaufort Sea coast at North Head, Richards
Island, Canada. Records start in
1991, 92 or 93 and continue.
Maximum
annual thaw penetration and maximum heave and subsidence of the ground surface is measured using a modified version of a frost tube
developed by Mackay (1973).
The device is a removable water-filled clear plastic observation tube, 2
cm in diameter, and ~2.5 m long inside a ~2.5 cm diameter, heave resistant
access tube (Tarnocai et al 2004) long enough (~4 m)
to be anchored in permafrost upon installation. The ice-water interface in the
observation tube corresponds to the frost table in the surrounding ground. A 3 mm diameter coloured
glass marker, dropped into the tube
each year prior to time of maximum thaw, rests on the ice surface, descending
during the thaw season to be trapped at maximum depth on freeze back in late
summer or fall. Maximum heave and
subsidence is recorded between observations by a scriber attached to a weighted
sleeve around the outside of the access tube, scratching a painted surface
either side of a reference mark (renewed at each visit). Tubes were installed using a light
weight pump (~10 kg, maximum discharge 100 litres/min). The active layer is defined as the thaw
recorded in the thaw tube, minus the height of the tube above the ground
surface at maximum surface subsidence, assumed to occur about the time of
maximum thaw.
Snow
pack observations were taken during March or April, and are reported as a range
of values from all the observations at the site.
Many
of the thaw tube sites are also instrumented with automatic air and ground
temperature loggers (Tarnocai et al 2004). At some 40 sites, a 6-plate 12 cm
diameter radiation shield (R.M. Young, model 41301-5) was mounted 1.5 m above
the ground surface and air temperatures are measured by a thermistor in the
shield that is connected to a single channel miniature data logger in the lower
part of the mast (see Fig. 5 in Nixon et al., 1995). A similar miniature data logger with
internal sensor is buried near the base of the air temperature mast at a
nominal depth of 3-7 cm to measure near-surface ground temperatures. Two types of miniature data loggers have
been used: HOBO loggers (Onset Computer Corp, USA.), range -37o to
46oC, resolution 0.25oC and Minilog
loggers (Vemco Ltd., Canada), -50o to 40oC,
resolution 0.3oC. Temperatures are recorded every 2 to 6 hours for a
year or more before servicing.
Data
provided are from 10 IPA Circumpolar Active Layer Monitoring sites.
Site-specific metadata
is available in MTmeta_calm_07.doc
REFERENCES:
Nixon, F.M. and Taylor, A.E. (1994). ‘Active layer
monitoring in natural environments, Mackenzie Valley, Northwest
Territories’. in Current Research 1994-B, Geological Survey of Canada, pp. 27-34.
Nixon,
F.M., Taylor, A.E., Allen, V.S. and Wright, F.(1995).
‘Active layer monitoring in natural environments, lower Mackenzie Valley,
Northwest Territories’. in Current Research 1995-B, Geological Survey of Canada, pp.
99-108.
F.
Mark Nixon and Alan E. Taylor (1998).‘Regional
Active Layer Monitoring Across
the Sporadic, Discontinuous and Continuous Permafrost Zones, Mackenzie Valley,
Northwestern Canada; in proceeding of 7th International Conferenece on Permafrost, Yellowknife.
Nixon, F.M. (2000).
‘Thaw-depth monitoring’. in The Physical Environment of the Mackenzie
Valley, Northwest Territories: a Base Line for the Assessment of Environmental
Change, (ed.) L.D. Dyke and G.R. Brooks; Geological Survey of Canada,
Bulletin 547, p. 119-126.
Wolfe, S.A., Kotler, E., and Nixon,
F.M. (2000).
‘Recent warming impacts in the Mackenzie Delta, Northwest Territories,
and northern Yukon Territory
coastal areas’; in Current Research
2000-B1, Geological Survey of Canada, 9 p. (online; http://www.nrcan.gc.ca/gsc/bookstore)
Smith, S.L., Burgess, M.M. and Nixon,
F.M. (2001).
‘Response of active-layer and permafrost temperatures to warming during
1998 in the Mackenzie Delta, Northwest Territories and at Canadian Forces
Station Alert and Baker Lake, Nunavut’; in Current Research 2001-E5, Geological Survey of Canada, 8 p.
Nixon,
M., C. Tarnocai and L. Kutny. (2003). ‘Long-term active layer
monitoring: Mackenzie Valley, northwest Canada’; in M. Philips, S. Springman
and L.U. Arenson (eds.), Permafrost, Vol. 2, A.A. Balkema
Publishers, Swets & Zeitlinger,
Lisse, The Netherlands, pp. 821–826.
Charles Tarnocai, F. Mark Nixon, Les Kutny. (2004). ‘ Circumpolar-Active-Layer-Monitoring
(CALM) sites in the Mackenzie Valley, northwestern Canada’; Permafrost
and Periglacial Processes, Volume 15, Number 2, pp. 141-153.
Dyke, L.D., 2000. Stability of permafrost slopes in the
Mackenzie Valley; In The Physical Environment of the
Mackenzie Valley, Northwest Territories: A Base Line for the Assessment of
Environmental Change, Dyke LD, Brooks GR (eds).
Bulletin 547, Geological Survey of Canada, p. 161–169.
Edlund, S.A., Alt, B.T. and Young, K.L.(1989). ‘Interaction of climate, vegetation, and soil
hydrology at Hot Weather Creek, Fosheim Peninsula,
Ellesmere Island, Northwest Territories’. In Current Research 1989-D. Geological Survey of Canada, Ottawa,
Ontario, pp. 125-133.
Kokelj S.V. and C.R. Burn,
2005. Geochemistry of the active layer and near-surface permafrost, Mackenzie
delta region, Northwest Territories, Canada; Canadian Journal of Earth
Sciences, 42(1), p. 37-48.
Mackay, J. Ross (1973). ‘A frost tube
for the determination of freezing in the active layer above permafrost’.
Canadian Geotechnical Journal, 10, 392-396.
(1975). ‘The stability of
permafrost and recent climatic change in the Mackenzie Valley, N.W.T.’. In Report of Activities, Part B, Geological Survey of Canada, Paper
75-1B, pp. 173-176.
(1976). ‘Ice-wedges as
indicators of recent climatic change, western Arctic coast’. In Current Research 1976-A, Geological Survey of Canada, pp.
233-234.
Quinton WL, Shirazi
T, Carey SK, Pomeroy JW., 2005. Soil water storage and
active-layer development in a sub-alpine tundra hillslope, southern Yukon
Territory, Canada; Permafrost and
Periglacial Processes, 16:
p. 369–382.
Waelbroeck, Claire, Monfray,
P, Oechel, W.C., Hastings, S. and Vourlitis,
G. (1997). ‘The
impact of permafrost thawing on the carbon dynamics of tundra’. Geophysical
Research Letters, 24,
229-232.